
Onward and Upward
Making the Transition From Universal Analytics to Google Analytics 4

By Adam Haber | October 25, 2022
Unless you happen to live in a remote corner of the Amazon rainforest or forgot to login to your Google Analytics (GA) account this year, chances are you’ve seen the following announcement:
![]() That’s right, folks! Universal Analytics (UA) has been given an official “deprecation date”… which means it is now on the equivalent of life support for dying software.
That’s right, folks! Universal Analytics (UA) has been given an official “deprecation date”… which means it is now on the equivalent of life support for dying software.
In less than nine months, Google will stop collecting new hits in UA1. While historical data will remain intact through at least the end of next year, our friends in Mountain View have made it clear that they intend to pull the plug on Universal Analytics sometime soon – perhaps as early as January 1, 2024. When that happens, you will permanently lose access to all your UA properties and views through both the web interface and API.
For many in the GA community, the impending demise of Universal Analytics has triggered a wave of panic attacks. But if it’s left you feeling anxious about the future, don’t worry – there’s plenty of light at the end of the tunnel! This article explains the rationale behind Google’s decision, highlights some of the key benefits of GA4, lays out a roadmap for the migration process, and discusses the mindset you’ll need to survive (and thrive) in a post-UA world.
So long, Universal Analytics. It’s been real.
With tens of millions of active users, UA is by far the most popular web analytics tool ever created2. But like virtually everything else in the tech space it is rapidly becoming obsolete. The platform’s core architecture was developed over a decade ago, at a time when most people surfed the web on desktop computers, mobile apps were relatively scarce, data from browser cookies was easily accessible, and there were very few laws in place to protect data privacy.
Ten years later the environment has changed dramatically. Mobile devices now comprise a majority of all internet traffic, apps are ubiquitous3, virtually all the leading web browsers (with the notable exception of Chrome) have taken steps to shield their users from “covert data collection and exploitation” methods4, and legal/regulatory frameworks aimed at protecting data privacy have sprung up in many parts of the world.
Universal Analytics also has an antiquated data structure which is ill suited to the complexities of today’s digital ecosystem. Traditional web metrics such as sessions, pageviews, and hits – which have been around since the early days of the internet – do a poor job of measuring engagement with iOS, Android, and other apps. And while UA does incorporate a few elements of the event-driven models which have become the norm in recent years, its four event parameters (category, action, label, and value) are too limited and hierarchical to capture the vast stream of data points emanating from many websites and mobile applications.
These tectonic shifts in the digital topography, coupled with major changes in user behavior, are forcing analytics “dinosaurs” like UA to adapt. Enter GA4…
Introducing Google Analytics 4
GA4 is Google’s newest digital analytics tool. As the name implies, it is the fourth generation in a line of products stretching back more than 15 years. Earlier iterations of GA include the largely defunct Classic Analytics (2007);5 Universal Analytics (2012), the version most companies are still running today; and the aptly, if uninspiringly, named App+Web (2019).6
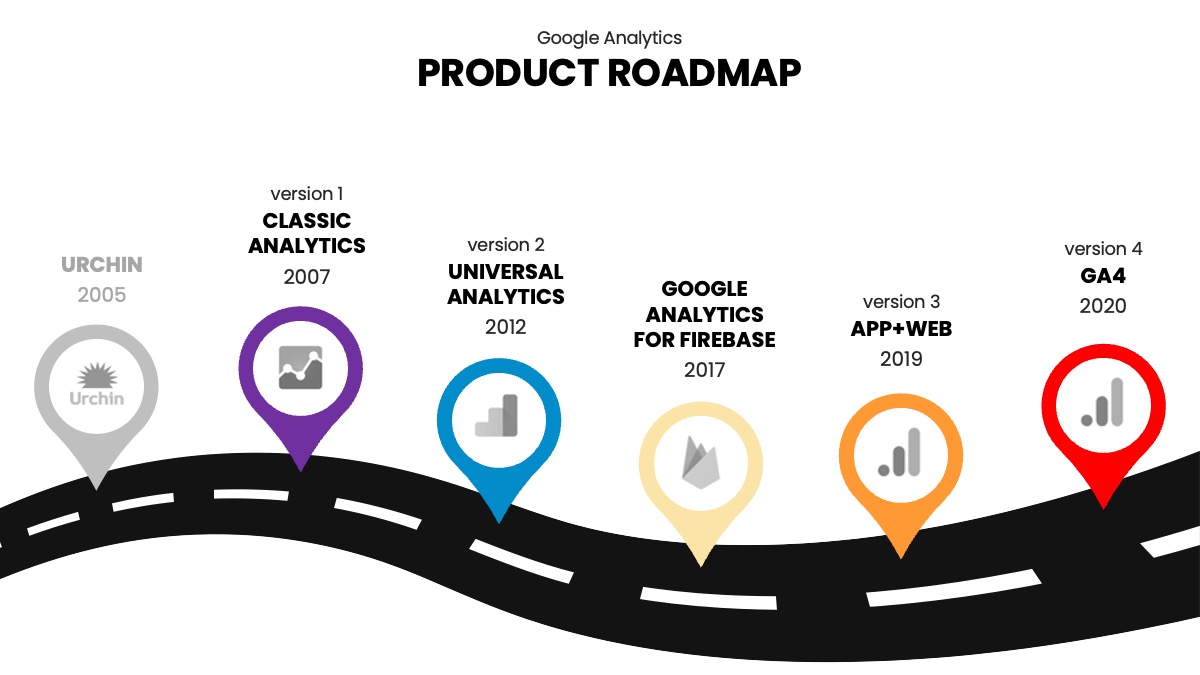 Before the emergence of App+Web properties three years ago, data from conventional websites and mobile applications had to be collected, stored, and analyzed in completely independent platforms. Web data resided in Universal Analytics and app data lived in another tool known as Google Analytics for Firebase (released in 2017). App+Web effectively bridged the two silos by combining both types of data in a single, integrated solution.
For all intents and purposes, GA4 is App+Web rebranded. While it’s still a work in progress, the tool offers many of the long-awaited design changes and improvements that UA desperately needs. As such, it is undoubtedly better equipped to meet the challenges of an increasingly complex and multifaceted digital landscape.
Let’s take a closer look at some of GA4’s key features and benefits…
Why Upgrade?
For starters, you don’t have much choice. Not if you want to stay in the Google ecosystem beyond 2023, anyway. As we said at the outset, Universal Analytics is on the verge of extinction.
But if that’s not enough incentive to upgrade, here are eight more reasons you should consider migrating pronto…
Reason #1: A Superior Data Model
 Google Analytics 4 is built on a totally revamped measurement system. If events are the distant outer planets in Universal Analytics, they are the suns in GA4. Almost everything in the new data model revolves around them in some way, and there’s no limit to the number of events you can have in a standard web data stream.7 In addition, each event may contain up to 25 parameters (more than 6 times as many as UA allows). For example, the submission event for a newsletter sign-up form might include the form ID, form name, form type, and other attributes. GA4 also provides 25 user properties (similar to user-scoped custom dimensions in UA) for describing various attributes of your visitors.
Collectively, these changes to the underlying architecture of Google Analytics represent a huge leap forward. They give GA4 more flexibility, scalability, and analytical horsepower than previous iterations – all of which should lead to better insights and ultimately higher ROI.
Reason #2: Automatic Data Collection
 GA4 has a new Enhanced Measurement feature which automates (or at least streamlines) the tagging of several common events including pageviews, scrolls, outbound link clicks, file downloads, site searches, video engagements, and form interactions.8 By simply toggling on a switch in the interface, users can track the desired behavior without manually adding tags or relying on a developer to insert any code snippets. While it’s not foolproof (certain functions may be built in a way which is incompatible with the native event listeners), Enhanced Measurement is nonetheless a welcome addition to the GA toolkit that takes some of the “heavy lifting” out of the data collection process.
Reason #3: A Robust Data Analysis Tool
 Although GA4 still lacks many of the standard reports to which Universal Analytics users have grown accustomed, one giant silver lining is the inclusion of a powerful data analysis tool called Explorations. Until recently, this advanced feature was only available to GA360 customers paying upwards of $150K/year for an enterprise license!
As Google describes them, Explorations are “a collection of advanced techniques that go beyond standard reports to help you uncover deeper insights about your customers’ behavior.”9 Among other things, the suite gives you the ability to run ad hoc queries; sort, modify, filter, and drill down in to various data elements; create, apply, and compare audience segments; share results with other GA users; and export data for mining, modeling, and reporting in other platforms such as SAS, Tableau, or Power BI.
One of the most useful Exploration techniques is funnel reporting. It gives marketers and analysts a highly detailed yet intuitive way to visualize the steps that users take before converting (and also shows where they abandon the process).10 From a “look-and-feel” standpoint, Funnel Explorations resemble the Shopping Behavior and Checkout Behavior reports in Universal Analytics. However, they’re a lot more customizable, dynamic, and interactive.
For example, suppose you run an e-commerce site. Prior to buying your product, users typically go through the following sequence of events (all of which are tracked in GA4):
-
View item list
-
Select item
-
View item
-
Add to cart
-
Begin checkout
-
Add shipping details
-
Add payment details
-
Purchase
Constructing a funnel with these actions will allow you to see how many users progress from one step to the next (or cumulatively from step 1 to step N), how many drop out, the completion and abandonment rates, and even the average time it takes to move between events. In addition, you can easily break down the activity by multiple dimensions (e.g., device type, channel, country, etc.) and compare the performance of up to three audience segments (say Regions A, B, and C) side by side.
Reason #4: A Free BigQuery Connection
 Google Big Query (GBQ) is a cloud-based, serverless data warehouse for managing and analyzing raw, event-level data. It’s packed with a host of cutting-edge tools such as machine learning, predictive modeling, geospatial analysis, real-time analytics, and a business intelligence engine.11
Like Explorations, GBQ is another advanced feature which was previously reserved for GA360 customers. With GA4, you now get a free instance of BigQuery without having to shell out major bucks for the enterprise license. Score again! Although you still need to pay for usage, Google’s free tier gives you up to 10 GB of storage, 1 TB of query processing, and 1 GB worth of BI Engine capacity (for Looker Studio12 Users) per month at no charge.13 This perk alone is worth its weight in gold for many businesses.
Reason #5: Simplified Cross-Domain Tracking
 Due to the security policies built into modern web browsers, cookies such as the Google Analytics “Client ID” (which is used to uniquely identify each visitor) can only be accessed from the domain on which they’re written. Cross-Domain Tracking (CDT) is essentially a way to get around this restriction. By passing the Client ID from one site to the other, GA can stitch together the hits and attribute them to the same “person”. Without that nifty trick, the data collected on domain A and domain B would look like it came from two separate users and sessions.
In Universal Analytics, cross-domain tracking can only be implemented through Google Tag Manager (GTM) or manual alterations to the site code. In GA4, you can do it directly in the interface with just a few clicks. Like Enhanced Measurement, there are cases in which the new CDT feature may not work out-of-the-box (at which point you will need to configure it manually). However, this change should make the setup process easier for the majority of GA users.
Reason #6: More Privacy Protections
 The past ten to fifteen years have witnessed an explosion in online surveillance tactics along with countless data breaches and the rampant collection, sharing, and misuse of Personally Identifiable Information (PII). In response to these disturbing trends, numerous government entities have enacted laws to control the types of user data that can be “harvested” from websites, mobile apps, and other digital properties; the places it can be transmitted and stored; and ways in which it can be utilized. The most well-known and far-reaching examples are the General Data Protection Regulation (GDPR) in the European Union and the California Consumer Privacy Act (CCPA) here in the United States.14 However, the GDPR and CCPA are far from unique. Indeed, a raft of other countries, regions, and states have also established their own privacy frameworks or are in the process of doing so.15
Given the current climate, it should come as no surprise that GA4 was engineered to be more privacy conscious than its forebears – an approach Google calls “privacy by design”. Several new features built into the platform make it easier for companies to safeguard PII and other sensitive data.
These include:
-
IP anonymization (also supported in Universal Analytics but switched off by default)
-
The fact that GA4 does not log or store IP addresses at all (though they are still used for geolocation purposes before being discarded)
-
The fact that GA4 collects data from EU-based devices on servers which are physically located in the EU (though this does not mean the tool as a whole is GDPR compliant)
-
Shorter data retention periods (up to 14 months as opposed to the “never expire” setting in UA)
-
The ability to selectively disable Google Signals as well as granular location (e.g., city, latitude, longitude) and device (e.g., browser, user-agent string, brand/model, operating system, screen resolution) data on a per-region basis.16
Reason #7: A New Debugging Tool
 GA4 comes with a built-in web debugger called DebugView. Before you can use it, you must enable the tool by activating GTM’s Preview Mode, turning on the GA Chrome extension, or manually sending a “debug_mode” parameter (_dbg) with each hit. Once enabled, DebugView shows a stream of real-time events coming off your website or app. Every event has an icon and associated timestamp, and they’re displayed in chronological order from the oldest (bottom) to the newest (top). You can also drill down into each hit to see all the individual key/value pairs that were received by GA4.
For novice users, the sheer amount of data and the speed at which new events appear in the debugger can be a bit overwhelming at first. Like many aspects of web analytics, it takes practice and you need to know what you’re looking for. But once you get the hang of it, you may come to regard DebugView as one of the coolest enhancements to GA4.
Reason #8: A Better Audience Builder
 In Google Analytics, an “audience” is a group of users who share some common characteristic(s). For example, one audience might consist of visitors who have completed a purchase in the last 30 days. Another might contain users who started to fill out a registration form but encountered an error. The possibilities are endless.
Although UA has a perfectly serviceable audience builder, GA4 takes it to the next level. One of the most promising changes is the addition of “audience triggers”. These allow you to programmatically generate an event each time a new user is admitted to a particular group.
As an example, imagine the World Wildlife Fund (WWF) has a homepage banner featuring an adorable baby elephant. They want to understand how much this image moves the needle on high-value donations. WWF sets up an audience trigger for visitors who click the “Donate Now” button and subsequently give $250 or more. Once created, the trigger automatically emits an elephant_donor event whenever a new user joins the group.
The resulting data would have at least three practical applications. First, if WWF were to break down the auto-triggered events by day, it could measure changes in the size of this lucrative audience over time. Second, WWF could compare “elephant donors” to other audiences (e.g., “polar bear donors” or “timber wolf donors”) to see how they differ with respect to marketing channels, landing pages, device types, geographic areas, or other dimensions. Finally, WWF could register the event as a conversion and send the data to a linked Google Ads account for use in an elephant-related ad campaign.
Migrating to GA4: Out with the Old, In With the New

The time has come to leave UA behind and embrace GA4. But how should you go about the actual migration process? And what should you expect during and after the transition?
Step 1
Take a comprehensive inventory of your current Universal Analytics implementation:
-
How many properties and views do you have?
-
What data is in each one?
-
Which domains/subdomains are they mapped to?
-
What filters do they use?
-
Are all of them still active, relevant, and useful?
-
What events are being captured?
-
Do you have standard naming conventions for event category, action, and label parameters?
-
How are you tracking your campaigns?
-
What are your conversion goals?
-
Are there any custom channel or content groupings?
-
What reports do you tend to look at on a regular basis?
Step 2
Carefully evaluate each item in your inventory:
-
Does this element (or a close counterpart) exist in GA4?
-
If so, are you going to keep it as-is, modify it, or discard it?
-
If not, do you want to replace it with something new?
Then step back and look at the bigger picture:
-
How valuable is the data you’ve been collecting?
-
Are there any gaps in the tracking framework?
-
What about data integrity issues?
Approach these tasks with an open mind. Question everything! Don’t just assume that the current setup will (or should) be duplicated in GA4. For one thing, much of it may have been created months or years ago – possibly by employees, agencies or consultants who are no longer affiliated with your organization – at a time when your business and website/app looked very different. But even if you wanted to simply “copy/paste” your implementation from UA to GA4, it may not be technically possible. As noted above, the two platforms are built on fundamentally different structures. Hence some of the elements in Universal Analytics do not even exist in Google Analytics 4 (and vice-versa).
To give an example, let’s say your UA property contains three separate views: North America, Europe, and Asia. You’d like to keep them in GA4 but… GA4 doesn’t have views!!! Google eliminated that part of the account structure altogether. So how are you going to isolate each region? Clearly it calls for a different approach.
Use the status quo as a starting point but don’t lock yourself into it. Instead, view the migration process as an opportunity to reimagine – and if necessary, retool – your entire data collection framework. After all, what’s the point of moving into a brand new house (GA4) only to fill it up with all the junk from your old one (UA)?
Step 3
Develop an implementation plan. At minimum it should:
-
Define the events you want to track
-
Determine what category each event belongs to (automatically collected, Enhanced Measurement, recommended, or custom)17
-
List the event- and user-level parameters you intend to collect for each event
-
Identify all your internal domains
-
Identify any external domains (e.g., third-party payment processors or password-reset features) which you do not want to treat as referrals
-
List the individual IP addresses or IP address ranges of your internal users
Step 4
Create a new GA4 property, then configure it using your implementation plan as a guide. The single most important task in this step involves the creation of a data stream (essentially a repository for all the data flowing out of your website or mobile app).
Within the data stream you should:
-
Toggle on/off the appropriate Enhanced Measurement options depending on what you want to track (pay special attention to Site Search as the query parameters may need to be adjusted if your site doesn’t use one of the defaults)
-
Configure your internal domains
-
List any unwanted referrals
-
Define your internal traffic rules
-
Review/adjust the session timeout and engagement time settings
In addition, you may need to configure or fine-tune many other aspects of GA4 such as:
-
Data Collection options
-
Data Retention settings
-
Data Filters
-
Reporting Identity methods
-
Attribution Settings
-
Product Links (Google Ads, Search Console, BigQuery, etc.)
-
Custom Definitions (i.e., Custom Dimensions and Metrics)
-
Conversions
Step 5
Configure all the tags, triggers, and variables for the events you want to track. This can be done in GTM (recommended) or directly in the site code (if you don’t utilize a tag management system). Note that in some cases you may be able to leverage triggers and/or variables from your UA implementation. However, the tags themselves will need to be built separately. That’s because GA4 uses its own set of tag templates and the “payload” (the data you’re actually sending to Google Analytics for any given event) may be different in GA4 vs. UA.
Step 6
Test your new GA4 framework… thoroughly. This can be done with the help of GTM’s preview mode, GA4’s new DebugView, GA4’s Real-Time reports, Chrome’s developer tools, and/or many browser extensions.18
Check each individual tag to make sure that it:
-
Fires when and where expected
-
Contains the right parameters and values
Here again, use your implementation plan as a reference.
Step 7
Once you’re satisfied that everything is completely dialed in, deploy your changes to the live site. Then repeat Step 6 (this time in production) to ensure that all the plumbing still works as intended. At this point you should also start to see data from “real” users in the Real-Time reports, although other reports may take up to 24 hours to populate.
Adopting the Right Mindset

First off, recognize that you’re not dealing with a minor cosmetic change here. Virtually everything in Universal Analytics (and we mean everything!) – the data model, account structure, configuration settings, user interface, standard reports, dimensions and metrics, conversion goals, custom event parameters, default channel rules, campaign tracking and attribution, you name it – has been modified to some extent. And GA4 has plenty of new features to get acquainted with as well. Consequently, the transition is not as easy as it might seem.
Second, be willing to let go of the familiar. Many “old school” GA users have told us they’re waiting until GA4 looks and behaves exactly like Universal Analytics (Spoiler alert: that’s never going to happen. And besides, UA was far from perfect anyway.). Others have already made the switch, only to revert back to UA after discovering that GA4 is a very different animal than the Google Analytics they know and love (What happened to bounce rate? Where can I see avg. time on page? Why can’t I do X, Y, or Z anymore?). There’s a lesson to be learned from these stories: it’s difficult to move forward when you’re stuck in the past.
Third, get comfortable with the idea of being uncomfortable. Change is hard. No undertaking of this scope and magnitude is ever “seamless”. Expect a certain amount of disruption. Accept the fact that things are going to be messy for a while. You’re bound to make some mistakes along the way. And the feelings of uncomfortableness are likely to persist well after GA4 is deployed. In the beginning you’ll fumble awkwardly through the new navigation menus and reporting interface. You won’t know where or how to find the data you need. At times you may be tempted to ditch the whole thing and retreat to the safety of UA. But hang in there! All of this is a perfectly normal (if unavoidable) part of the process.
Summary
For nearly a decade, Universal Analytics has been the platform of choice for millions of analytics users around the world. But the reality is that UA is going away… and soon. If you haven’t already done so, consider making the switch to Google Analytics 4 while there’s still time. Migrating now will allow you to get acquainted with the new platform and collect as much historical data as possible before UA finally disappears for good (likely in 2024).
Not only that, but GA4 is just a better all-around tool for this day and age. Unlike UA, the platform is built on a flexible and scalable event-driven model which is much more capable of measuring user behavior in today’s complex digital landscape. It also combines data from both websites and mobile applications and includes a host of powerful features such as automatic tagging, a cutting-edge data exploration tool, a built-in debugger, a free instance of Google BigQuery, and a more sophisticated audience builder. In addition, GA4 is more privacy-centric, which means it’s better suited to a legal and regulatory climate that is increasingly focused on protecting users’ private data.
The transition from UA to GA4 won’t be an easy one. But like the saying goes: no pain, no gain! With a little time and patience (plus a lot of planning and determination), you will emerge from the migration process in a better place.
- GA360 customers get a three-month extension to October 1, 2023.
- In total, more than 33.9M live websites are running some form of Google Analytics (see BuiltWith, Google Analytics Usage Statistics, https://trends.builtwith.com/analytics/Google-Analytics). While data on specific versions is hard to come by, UA is almost certainly the most common given how long it’s been around and the fact that GA4 was just released from beta less than two years ago.
- As of Q2 2022, there were nearly 6.2M apps available in the top three app stores, including 3.5M in the Google Play Store, 2.2M in the Apple App Store, and 480K in the Amazon App Store. See “Number of apps available in leading app stores as of 2nd quarter 2022,” L. Ceci, Statista, August 11 2022.
- Such as third-party cookies, link and referrer decoration, fingerprinting, and CNAME records. See “Tracking Protection” (https://www.cookiestatus.com/introduction/tracking-protection/) and “Summary of Exploits” (https://www.cookiestatus.com/introduction/summary-of-exploits/).
- Classic Analytics was actually derived from a piece of non-Google technology developed by software maker Urchin, which Google acquired in 2005. For a riveting, firsthand account of Urchin and its ultimate transformation into the juggernaut we know as Google Analytics, check out: “Urchin Software Corp.: The unlikely origin story of Google Analytics, 1996-2005-ish,” Scott Crosby, September 2 2016, https://urchin.biz/urchin-software-corp-89a1f5292999. Also this interview with another Urchin cofounder, Brett Crosby: https://www.youtube.com/watch?v=XXa-FLZYZzo.
- See “A new way to unify app and website measurement in Google Analytics,” Russell Ketchum, Google Marketing Platform, July 31 2019, https://blog.google/products/marketingplatform/analytics/new-way-unify-app-and-website-measurement-google-analytics.
- App data streams are limited to 500 unique events each (the same as in Firebase). See “[GA4] Event collection limits,” https://support.google.com/analytics/answer/9267744.
- “[GA4] Enhanced measurement events,” https://support.google.com/analytics/answer/921606.
- “[GA4] Get started with Explorations,” https://support.google.com/analytics/answer/7579450.
- “[GA4] Funnel exploration,” https://support.google.com/analytics/answer/9327974.
- “BigQuery,” https://cloud.google.com/bigquery.
- Data Studio was expanded and renamed to Looker Studio in the fall of 2022. “Introducing the next evolution of Looker, your unified business intelligence platform,” https://cloud.google.com/blog/products/data-analytics/looker-next-evolution-business-intelligence-data-studio.
- “BigQuery Pricing,” https://cloud.google.com/bigquery/pricing#free-tier.
- See “What is GDPR, the EU’s new data protection law?” (https://gdpr.eu/what-is-gdpr/) and “California Consumer Privacy Act (CCPA)” (https://oag.ca.gov/privacy/ccpa).
- Thus far, more than 80 countries have passed some form of privacy legislation. For a general overview, see “What’s Data Privacy Law In Your Country?,” July 1 2022, https://www.privacypolicies.com/blog/privacy-law-by-country/. In addition, five other US states – including Colorado, Connecticut, Utah, and Virginia – have followed California’s lead and either introduced or passed their own privacy bills. See “Comparing US State Privacy Laws,” OneTrust, eBook, June 2022, https://www.onetrust.com/resources/comparing-us-state-privacy-laws-ebook/.
- “EU-focused data and privacy,” https://support.google.com/analytics/answer/12017362.
- “[GA4] About events,” https://support.google.com/analytics/answer/9322688
- Our personal favorites are David Vallejo’s GTM/GA Debugger, Adswerve’s dataLayer Inspector, and dataslayer.